Creating bike routes with python

This weekend my goal was to ride 50 miles to and from my house. In my last post I showed four ways to find where I could get to for a certain distance, but I really hate “there and back” rides, so I wanted to find loop-based routes that would have my target distance and not have any doubling back. I used basically the same tools and I’m decently happy with the results.

tl;dr here’s the route

How’d I do it?

Here’s the basic gist of what I did:

  1. Get the lat/long of my house to have a starting point
  2. Do some geo-based math to find points on a regular polygon that includes my house. I set the polygon perimeter length to my target length
  3. Ask openrouteservice to find directions to all of the points in order (beginning and ending at my house)
  4. Adjust the total polygon perimeter until the actual path is my target distance
  5. Construct a google maps URL so that I can navigate while riding

Step one: lat long of my house

This one is easy. Just open google maps and right click anywhere to get the latitude and longitude

After doing that here’s what’s in your clipboard: 44.9240104020827, -93.09348080561426

So just paste that somewhere in your python code as a list and you’re good to go.

Step 2: Geo-based math for other points

I’m pretty sure I could have used some package to do this, but I figured it wouldn’t be that hard to just code up a sloppy version, especially since I knew I’d have to make adjustments to the polygon positions so that the actual travel distance would be what I wanted (see step 4).

If you have the lat/long of a point and want to find a point some known distance away in some particular direction (say \theta degrees counterclockwise from east), you need to realize that while moving north/south follows a great circle (with a radius equal to the earth’s), moving east/west is not moving along a great circle (which is why you have to turn slightly north when driving straight east). Instead you’re moving on a circle whose radius is the earth’s radius multiplied by the cosine (ugh) of the latitude. If you were thinking it should have been sine (like my first thought) it’s likely because you’re used to using polar angles in mathematics (ie, the zero of latitude is the equator, not the north pole). Also, as you’ll note looking at the lat/long I pasted in above, since I’m roughly at 45 degrees latitude, it doesn’t really matter.

So here’s how I coded it:

earthRad=6378.1
def newPoint(start, angle, distance):
  [long,lat]=start
  horizScale=earthRad*math.cos(lat*math.pi/180)
  newLong= long+distance*math.cos(angle)/horizScale*180/math.pi
  newLat=lat+distance*math.sin(angle)/earthRad*180/math.pi
  return [newLong,newLat]

Ok, so now I just need to make a bunch of points on a regular polygon:

def polygon(sides,start,totalDistance,initialAngle=0):
  theList=[start]
  curLoc=start
  for x in range(sides):
    curLoc=newPoint(curLoc,x/sides*2*math.pi+initialAngle,totalDistance/sides)
    theList.append(curLoc)
  return theList

You might wonder about that “initialAngle” part. I found that being able to tilt the initial polygon helped because I have a big river just east of me that the mapping software doesn’t like (only if you try to do bicycle navigating right into the river).

Step 3: Use openrouteservice to map it out

Here’s the code I used:

import openrouteservice as ors
from openrouteservice import convert
import folium
import math
token="GET YOURS FROM OPENROUTESERVICE"
client=ors.Client(key=token)
home=[PASTE THIS IN FROM GOOGLE MAPS]
directions=client.directions(profile='cycling-regular', coordinates=polygon(7,home[::-1],60,3*math.pi/4))
directions['routes'][0]['summary']['distance']

You can get your own token by signing up (for free!) at https://openrouteservice.org/ It has some limitations regarding how often you can use it, but they’re very generous, at least for this kind of thing.

The last line is what you have to do to get the total distance for the journey. You can see that the result of the “client.directions” command is a highly structured object (it took me a while to figure out how to extract that total distance). You get the map I generated above with this:

map=folium.Map(width=500, height=500,location=home)
folium.GeoJson(convert.decode_polyline(directions['routes'][0]['geometry'])).add_to(map)
map

Now you see why I had to import folium up above.

Step 4: repeat and adjust until you get the distance you want

You’ll note in the code above that I submitted points on a polygon that would have a total perimeter of 60 kilometers, but it returned a path that’s just over 80 km, or 50 miles (my original goal). The reason is mostly due to the taxi-cab geometry I talk about in my 2nd approximation in this post. In other words, there’s no way there are dead straight roads among all the polygon vertices, so you’re going to travel further.

Step 5: create a google maps URL

While I like the programmatic capabilities of openrouteservice, I *love* google maps as a navigation aid while riding. So I wanted to figure out how to get my newly found route into google maps. Solution: use their url api! On that page you can learn how to create URLs with starting points, ending points, way points (points along the journey), and type of directions (I wanted bicycle directions). Here’s how I built that:

pgon=polygon(7,home[::-1],60,1*math.pi/4)
baseUrl="https://www.google.com/maps/dir/?api=1&"
start="origin="+str(home[0])+","+str(home[1])
travelmode="travelmode=bicycling"
waypoints="waypoints="+"|".join([str(x[1])+","+str(x[0]) for x in pgon])
destination="destination="+str(home[0])+","+str(home[1])
baseUrl+start+"&"+travelmode+"&"+waypoints+"&"+destination

That gives you a URL that produces this:

And I’m finally ready to ride!

How it went (the actual ride)

It was a beautiful late October day and I really did have a blast. The mapping worked really well but there are some issues I had to deal with.

If you look at the image above, you’ll probably note the little spur on the eastern edge of the route. Essentially google’s mapping algorithm (really both algorithms if you go back and look at the first image on this post) didn’t know of a way to get to and from that particular waypoint without a little bit of doubling back. I didn’t want to do that, so I just figured I could delete that waypoint (google makes that pretty easy to do). However, if you delete it before you begin, google will try to find a faster way from the prior waypoint to the next one, so I just waited until I got close before deleting it. That worked well.

The other waypoints weren’t so far off a normal path, but I did do a lot of weird extra blocks to get to the exact point I asked for. I probably could have saved a few miles not doing that, but that wasn’t really the point.

Overall I think it worked out pretty well. I’m excited to do it again. I’ll probably just tilt the 7-sided polygon over just a little further to get a completely different ride.

Your thoughts?

Got any feedback for me? Here are some starters for you:

  • I love this! Can you do it for . . .?
  • I hate this! It’s obvious you could do this in a much easier fashion by . . .
  • What do you mean you have to turn a little north to drive straight east?
  • I think we should redo latitude so that the zero is at the north pole
  • Why python, I thought you loved Mathematica?
  • Why are the google and openrouteservice directions slightly different?
  • Why only 50 miles?
  • How long did it take you? (8 hours but that was with a really long lunch and a few other stops to read and watch rugby)
  • How did you find rugby to watch?
  • What’s wrong with using cosine (you said “ugh” after doing so)?
Posted in fun, math, programming, technology | 2 Comments

Gabriel’s Horn (guest post)

Last week I was intrigued by this post:

I asked, on Facebook, whether filling it with paint would essentially be painting it on the inside and I had a suspicion that my good friend Art Guetter (Professor of Mathematics at my institution) would help me learn something. I was right, and he’s been kind enough to type up his thoughts for this post. Here he shows that it’s pretty tough to use a finite amount of paint to paint anything infinitely long.

Guest post from Art Guetter

Gabriel’s horn is a solid created by rotating the graph of f(x) = 1/x, defined on the interval (1,\infty), around the x-axis. Two “paradoxes” arise. In the first, the horn has a finite volume, despite being created by rotating a region with infinite area around an axis. The second is that the horn has finite volume but infinite surface area, leading to the apparent paradox that the horn could be filled with a finite volume of paint, yet the paint would not be sufficient to coat (that is, paint) the surface. The resolution of this “painter’s paradox” is that the thickness of the paint would need to decrease to 0 in the limit as x tends to infinity. The assumption being made here is that painting requires a uniform thickness of paint. Note that I can paint the entire plane if I am allowed to decrease the thickness of paint as I move far from the origin.

So could I paint an infinite solid of revolution (to a uniform depth h) if the surface area were finite? As a first example, replace f(x) = 1/x from Gabriel’s horn with a piecewise constant function f(x) = r_n when n < x < n+1 for n = 1,2,3,\ldots, and the constants r_n to be determined later. The surface will consist of an infinite collection of right circular cylinders, and each cylinder will have surface area 2 \pi r_n. If the r_n are chosen so that the sum \Sigma r_n < \infty, can I paint the surface with a finite amount of paint? The answer appears to be “yes”, but this involves the assumption that I roll each cylinder open, so that the amount of paint used is simply the surface area multiplied by the thickness of the paint, say h. (Each cylinder can be rolled open without issue because they have thickness 0.)

What about painting if the cylinders aren’t rolled out? I will assume that painting to a thickness h means that the depth of paint at any point is h measured along the normal, in the outward direction. The amount of paint needed to paint one of the cylinders is then given by \pi [(r_n + h)^2 - r_n^2] = \pi [2 r_n h + h^2] = 2 \pi r_n [h + h^2/(2r_n)] = A_n [h + H h^2], where A_n is the surface area of the cylinder and H = 1/(2r_n) is the mean curvature of the cylinder. Summing this over n will lead to an infinite volume of paint, no matter how fast the r_n tend to 0.

A more general theorem has that the volume of a surface that has been thickened by an amount h in the direction of the normal to the surface (assuming that h is small enough that there is no self-intersection) is given by

V = h \cdot SA + h^2 \cdot \int H \; dA +\frac{1}{3} h^3 \cdot \int K \; dA

where SA is the total surface area, dA is the surface element, H is the mean curvature of the surface, and K is the Gaussian curvature. (These are constant for the cylinder, with values H = 1/(2 r_n) and K = 0.) The amount of paint needed to paint a surface to uniform thickness depends on the curvature of the surface.

For a surface created by revolving the curve y = f(x) around the x-axis, the values of H and K depend only on x and are given by (in general and then for f(x) = 1/x)

H = \frac{1 + f'(x) - f(x)f''(x)}{2 f(x) (1 + f'(x)^2)^{3/2}} = \frac{x^7 - x^3}{2(1 + x^4)^{3/2}}

K = -\frac{f''(x)}{f(x) (1 + f'(x)^2)^2} = -\frac{2 x^6}{(1 + x^4)^2}

Posted in guest post, math | 1 Comment

What’s my 30 mile cycle limit?

UPDATED WITH 4th APPROXIMATION!

Last weekend I went hammock camping by towing all my gear behind my bike. I loved it and now I’m interested in finding other adventures that won’t tax me too much. I really think that, for now, 30 miles in one day towing the trailer is a good limit for me. It leaves me enough energy to make camp and I’m able to relax and enjoy myself.

1st approximation

My first thought was to just look at a map with a 30-mile radius circle centered on my house. I figured if I could find any campgrounds in that circle I’d be good to go.

30 mile radius circle around my house

The problem with this approach is that there aren’t any roads or paths that go straight from my house to the edge of this circle. Any way I’d ride out to that edge would be more than 30 miles of riding.

2nd approximation

I’ve noticed that I spend most of my time riding in the Cardinal directions (North, South, East, and West). What If I could figure out how far I could ride only going in those directions?

I realized that I could do a polar plot around my house if I could find a relationship between r (the radius) and theta (the angle with respect to East). It took a little head scratching, but here’s what I came up with:

r \cos(\theta)+r\sin(\theta)=D

or

r(\theta)=\frac{D}{\cos(\theta)+\sin(\theta)}

Actually that only works in the first quadrant. For all the quadrants you want the absolute value of both the cosine and sine term:

r(\theta)=\frac{D}{\left|\cos(\theta)\right|+\left|\sin(\theta)\right|}

A polar plot of that equation with D=1

Weird and surprising, right? I hope it was for at least a few of you. It surprised me! But of course, after some thought it makes some sense. As you give up height you get exactly that much more width. So a straight line with a slope of 45 degrees it is!

Now with the Cardinal direction limit.

So why doesn’t the blue square touch the red circle, you might be asking? Well, I’m not really sure. I got the locations of those 4 corners from Google Maps using the “Measure Distance” feature, whereas the red circle comes from the Circle command in python’s folium library. It’s weird that they’re so far off from each other, isn’t it?

The obvious problem with this solution is that not all roads/paths run along the Cardinal directions. I think that’s likely even more true for bike paths.

3rd approximation

I realized that Mathematica has the command TravelDirections that lets you put in two locations and a TravelMethod to get decent directions. I used “Biking” for the TravelMethod for all of this work.

I had Mathematica get directions for 36 evenly spaced locations on that red circle above. Then I took a look at the actual travel distance and they were all well over 30 miles. So then, for all 36 of those, I crept in towards my house by 1 kilometer until I got a path that was 30\pm1 
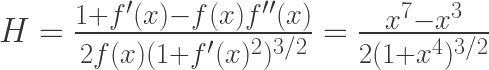
miles away. Then I just plotted them all to get a decent sense of my options:

The gray is a 30 mile radius disk and red are all the bike journeys I calculated

So I think this is my best approximation yet. It gives me a real good sense of how far I can get comfortably in one day. I haven’t really investigated the directions, but certainly I can see the exact path I took this past weekend in there (it’s the one that heads just a little west of south)

UPDATED: 4th approximation

Ok my mind was just blown with something called isochrones in the OpenRouteService available to python. Here’s my colab. And here’s the amazing result:

Isochrone approach limited to 30 miles of biking distance

Your thoughts

So what do you think? Here are some starters for you:

  1. This is cool! Have you thought of doing this . . .?
  2. This is dumb. Taxi drivers figured this out years ago
  3. Why do you only sometimes capitalize the carDinAl directions?
  4. Could you please share the colab doc you used for the folium maps?
  5. Could you please share your Mathematica code (saved at work and I’m typing this at home for the moment)?
  6. I live ____ and can ride ___ miles in a day. Could you do this for me?
  7. I know why the blue and red don’t touch, it’s because . . .
  8. That blue square didn’t surprise me at all. You’re dumb.
  9. That blue square totally surprised me! I learned something today!
  10. You’re going to tease us about your bike and not bother showing a pic?
my bike (Priority 600) and my homemade trailer
Posted in fun, math, mathematica, technology | 6 Comments

Classroom photo sharing app

For a long time I’ve wanted an app that could

  • Allow my students to take a picture of their work and share it with the class
  • Certainly my computer should be able to display it, but with thumbnails for all the images
  • Bonus if all the images are on everyone’s device

This post is about my attempt to make just such an app in Google Apps Script. It includes detailed instructions for how you can make your own copy. If you want to see it in action, see this vid.

Before jumping in, I want to say thanks to some great twitter friends who had thoughts about other ways to do this. I haven’t tried them all, but I think they all could work really well:

How to get it working for you

Below I’ll explain a little more about how it works, but one important feature is the use of webSockets. To do that I use a free account on pusher.com. It limits all my apps to 100 total simultaneous connections. For the purposes of this app, that means 100 students all sharing images with each other. That’s fine for me, since I’ve never taught a class that big, but I can’t just let everyone use my copy of the app since then I’ll hit that limit pretty quick. The good news is that if you follow the steps in this section you can have your own version up and running that’ll have its own 100-user limit.

So: Step 1, sign up for a pusher account. I described how in this post.

On to step 2. Make your own copy of this google sheet. Make a google folder to hold the images and make sure its contents are viewable to the world. Then follow the instructions in this vid (:

I made a copy in my consumer gmail account

And you’re done! Have fun!

To start the next class all you have to do is clear out the spreadsheet. You can delete the files in the image folder too if you want, but you wouldn’t have to.

Ways to use it

I think my ideal situation is when I ask students to work on something, either individually or in groups, and then letting them all review everyone’s work. Without this app I’ve done that in the past by gathering their personal whiteboards and showing the class what I’ve found or asking them to walk around and look at other groups’ whiteboards. This way they see everyone’s and they can zoom in all they want without trying to see past people. It’s somewhat anonymous since the system doesn’t capture who uploads the image (actually it does capture the email and the date but I haven’t bothered to use that info in the UI).

Here’s an example: “Ok everyone, write down something you know about the dot product. When you’re done, submit your photo.” It seems to me you’d get some cosine (ugh) thoughts, some vectors saying “hey you, how much of you is parallel to me”, and some component-by-component scribbles. Imagine the students scrolling through all of that and then asking what patterns they’re seeing!

I also think this could be interesting in other situations. Imagine if your students were out and about doing some observations or something. They could stay on top of what everyone is seeing with this app. In other words, they don’t have to be in the same room to use the app.

How it works

What’s stopped me in the past from making this app is the annoying habit of phone manufacturers where they make their cameras have incredible pixel densities. That means that the typical file sizes are multiple megabytes. That’s not really a big deal for your phone, but it means your uploads take a while and the server just gets hammered.

This time around I googled a little and found that you can resize images before uploading them. The local machine (your student’s phone) creates a much lower density copy and uploads that instead of the original. This also makes the final product much more responsive.

Next comes the hassle of uploading and saving files in google apps script. Here’s a chapter of my GAS book explaining how I do that, though I did a little different trickery due to the copy of the image that gets created by the local machine.

Next comes making a thumbnail-based image viewer. I just used what I found here. Of course I had to make it a little more dynamic, essentially recreating the thumbnails when a new image comes in. I don’t bother to make tiny images for the thumbnails, they’re just the full image shown small. But since they’re all pretty small to begin with, that works fine.

So all together then, here’s the life cycle:

  • A student loads the page
  • They’re shown any images that have already been uploaded.
  • If they upload a new one:
    • Their machine makes the low density version
    • and then sends it to google.
    • Google saves the image
    • retrieves the download url
    • saves the url in the spreadsheet (which is why the page loaded all the old ones to begin with)
    • and sends that url to all connected devices through pusher
  • When a pusher message is received, the student’s machine requests the new image from the google server
  • Then that image is added to the array of images at the top of the page.

Some issues:

  • For some crazy reason, this only works on iPhones if they use an incognito window
  • If for sure everyone loads the page at the beginning of class, you could skip the spreadsheet. But if they hit reload they’d lose all the old ones
  • I gather google isn’t crazy about being an image hoster. It’s possible they’ll throttle you. In my (admittedly small scale) testing, I haven’t seen that. Famous last words, maybe
  • I used a cool trick to automatically resize the image and upload it after a student selects the image. There’s no separate “submit” button. I like that
  • On both iPhones and android when you select a new image you get the choice of your camera to take a picture. I love that as it reduces the steps for the students.

Your thoughts?

I’d love to hear what you think. Here are some starters for you:

  • I love this. What I particularly like is . . .
  • I can’t believe you reinvented the wheel, especially after such great suggestions from twitter. Loser
  • I know why it has to use an incognito window on the iPhone . . .
  • What’s wrong with cosine?
  • Google here: cease and desist
  • pusher here: are you ever going to pay for our service (note, I have paid when my school has scaled up some of my projects – they let you go month to month which is great)
  • Here’s another cool way you could use it . . .
  • I don’t think you need to be so worried about the original sized images and here’s why . . .
Posted in Google Apps Script, syllabus creation, teaching, technology | Tagged | Leave a comment

Audience ranking questions

I’m helping to run a workshop this week and we realized that instead of using post-it notes through the day to capture “burning questions” we could use a tool that both collects questions and allows the audience to vote on them.

After the first day of post-it notes I volunteered to get us set up with one of the many systems that exist that do this. I went back to my hotel room and did the usual google searching, finding tools I had used (including the one that the Physics Education Research Conference organizers used earlier this month at their opening session) and others I hadn’t heard of. Unfortunately it seemed that most had a free level that only worked with 7 participants but it got expensive after that. Also most of the tools offered all kinds of extra bells and whistles, like tying in content or finding other ways to foster community, that we didn’t need.

I knew I could use the Q&A feature built into Google Slides (don’t know about that? Check it out!) but I knew there were two major issues: 1) it’s not really built to be open all day. In my experimentation in the past I noticed that the URL changes when you go back to the Q&A window a few hours later. Really that’s because it’s meant to be used in a typical 1-2 hour lecture, rather than a place to keep questions for a longer time. 2) while anyone can submit questions, you have to be logged into your Google account in order to be able to vote on questions. I’m not sure that’s a huge deal, but it always gives me pause when I’m dealing with an audience from diverse places. Certainly since my school has all our email powered by Google, it would be my go-to choice. Really it’s the first issue above that caused me to go down a different road for this workshop.

So as I was taking a shower after that disappointing google searching, it occurred to me that I might have the skills necessary to write my own solution. This post is about that.

Let’s first see it in action (there’s no sound, just trying to show all the features):

What are you seeing?

  • A big box at the top to add your question.
    • It has a placeholder encouraging you to type in your question. I find this much cleaner than a label above the box.
    • It clears the box out after the submission has been accepted (typically ~2 seconds)
  • A ranked list of questions that gets updated in real time
    • If the question is from you, you can’t “upvote” it
    • You can only vote once on a question
    • You can’t downvote or unvote a question
  • A quick description at the bottom indicating the limitations

If you care, the rest of this post explains how you could build this yourself. Why not just use mine? Because of the limitations listed at the bottom of the vid: it can only handle 100 simultaneous users. That’s totally fine for this workshop, but I can’t just provide this tool to everyone. Instead, all you need is:

  1. A google account (you need one, your users don’t)
  2. A pusher.com free-level account (this enables the webSocket technology and has the 100 simultaneous user limitation)
  3. A burning desire to help your fellow human beings

Set up Pusher

  • Sign up for a pusher.com account, specifying the “sandbox” plan.
  • Under “Channels” create an app
You should probably choose a name that’s easier to remember than the default one they’ll prefill that field with
  • Hit “Create app”
  • Navigate to the new app and click on “App Keys”
You’ll need all 4 of these in your Google Apps Script below.
  • You’re done with pusher!
  • Now on to setting up your google apps script

Set up the spreadsheet

You only two tabs:

  • “questions”
    • id
    • question
    • date
  • “votes”
    • id
    • date

Then open the App script window:

You don’t have to call your google sheet “pusher q&a sheet”, of course

In the app script window you should have a code.gs file. Add a main.html file and a pusher.gs file:

You can name your script whatever you want. Also note that after you hit the “+” button it asks what type of file you want so you don’t have to add the extension.

Here’s the code for Code.gs:

var funcs=[];
function doGet()
{
  var ss=SpreadsheetApp.getActive();
  var sheet=ss.getSheetByName("questions");
  var data=sheet.getDataRange().getValues();
  data.shift();
  var vsheet=ss.getSheetByName("votes");
  var vdata=vsheet.getDataRange().getValues();
  vdata.shift();
  var vobj={};
  data.forEach(d=>vobj[d[0]]=0);
  vdata.forEach(v=>
  {
    // if(!vobj[v[0]]) vobj[v[0]]=0;
    vobj[v[0]]++
  })
  var arr=data.map(m=>[m[0],m[1],vobj[m[0]]]);


  var t=HtmlService.createTemplateFromFile("main");
  t.funcs=funcs;
  t.funcnames=t.funcs.map(f=>f.name);
  t.globals={data:data, votes:vobj, arr:arr, myvotes:[]};
  return t.evaluate().setTitle("Sorted Questions");
}

const init=()=>{
  var cook=document.cookie;
  var str=cook.match(/votes=(.*)/);
  if (!str)
  {
    var list=[];
  } else {
    var list=str[1].split(",").map(m=>Number(m));
  }
  myvotes=[...myvotes,...list];
  displayQs();
}
funcs.push(init)

const displayQs=()=>
{
  arr.sort((a,b)=>b[2]-a[2]);
  // html=`<h1>Sorted Questions</h1>`;
  // html+=`<div><textarea rows="4" cols="50" id="newQuestion" placeholder="enter your question"></textarea></div><div><button onclick="newQlocal()">submit</button></div><hr/>`;
  var html="";
  html+=arr.map(a=>
  {
    var h=`<p>(${a[2]} votes) ${a[1]}`;
    if (!myvotes.includes(a[0]))
    {
      h+=` <button onclick="vote(this, ${a[0]})">upvote</button>`;
    } else {
      h+=` You upvoted`
    }
    h+="</p>";
    return h;
  }).join(" ");
  document.getElementById("main").innerHTML=html;
}
funcs.push(displayQs);

const newQlocal=()=>
{
  var question=document.getElementById("newQuestion").value;
  google.script.run.withSuccessHandler(newQBack).sendNewQuestion(question);
}
funcs.push(newQlocal);

const newQBack=(id)=>
{
  myvotes.push(id);
  var str=myvotes.join(",");
  document.cookie = "votes="+str+"; SameSite=none; secure";
  document.getElementById("newQuestion").value="";
  displayQs();
}
funcs.push(newQBack);

const vote=(el,id)=>
{
  // myvotes.push(id);
  google.script.run.withSuccessHandler(newVBack).sendVote(id);
}
funcs.push(vote);

const newVBack=(id)=>
{
  myvotes.push(id);
  var str=myvotes.join(",");
  document.cookie = "votes="+str+"; SameSite=none; secure";
  displayQs();
}
funcs.push(newVBack);


function sendNewQuestion(question) 
{
  var sheet=SpreadsheetApp.getActive().getSheetByName("questions");
  var data=sheet.getDataRange().getValues();
  data.shift();
  if (data.length==0)
  {
    var newId=1;
  } else {
    var newId=Math.max(...data.map(m=>m[0]))+1;
  }
  Logger.log(`new id is ${newId}`)
  var d=new Date();
  sheet.appendRow([newId,question,d]);
  sendToPusher("newQ", {row: [newId,question,0]});
  return newId
}

function sendVote(id)
{
  var sheet=SpreadsheetApp.getActive().getSheetByName("votes");
  var d=new Date();
  sheet.appendRow([id,d]);
  sendToPusher("newV", {id:id});
  return id;
}

Here’s the html for main.html:

<!DOCTYPE html>
<html>
  <head>
    <base target="_top">
    <link href="https://cdn.jsdelivr.net/npm/bootstrap@5.0.2/dist/css/bootstrap.min.css" rel="stylesheet" integrity="sha384-EVSTQN3/azprG1Anm3QDgpJLIm9Nao0Yz1ztcQTwFspd3yD65VohhpuuCOmLASjC" crossorigin="anonymous">

    <script src="https://js.pusher.com/5.1/pusher.min.js"></script>

  </head>
  <body onload="init()">
    <div class="container">
      <div>
         <h1>Sorted Questions</h1>
  <div><textarea rows="4" cols="50" id="newQuestion" placeholder="enter your question"></textarea></div><div><button onclick="newQlocal()">submit</button></div><hr/>
      </div>
      <div id="main">
      </div>
      <div>
        <hr/>
        <p>If your vote isn't registered after ~10 seconds, it means
        the system lost your vote. Feel free to try again. The system
        has a limit of 30 simultaneous votes and 100 connected users.</p>
    </div>

<script>
var globals = <?!= JSON.stringify(globals) ?>;
Object.keys(globals).forEach(key=>window[key]=globals[key]);
var funcnames=<?!= JSON.stringify(funcnames) ?>;
var funcs=[<?!= funcs ?>];
funcnames.forEach((fn,i)=>window[fn]=funcs[i]);

var pusher = new Pusher(key, {
    cluster: 'us3',
    forceTLS: true
  });

var channel = pusher.subscribe('my-channel');
channel.bind('newQ', function(data) {
  arr.push(data.row)
  displayQs();
  });
channel.bind('newV', function(data)
{
  var row=arr.find(f=>f[0]==data.id);
  row[2]++;
  displayQs();
})

</script>

  </body>
</html>

And here’s the code for pusher.gs:


var app_id = "YOUR APP_ID HERE";
var key = "YOUR KEY HERE";
var secret = "YOUR SECRET HERE";
var cluster = "YOUR CLUSTER HERE";


function sendToPusher(event,data) {
  var pvals={
    appId: app_id,
    key: key,
    secret: secret,
    cluster: cluster,
    encrypted: true
  };
  
  var url = `https://api-${pvals["cluster"]}.pusher.com/apps/${pvals["appId"]}/events`;
  var body = {"name":event,"channels":["my-channel"],"data":JSON.stringify(data)};
  var bodystring = JSON.stringify(body);
  var now=new Date();
  var d = Math.round(now.getTime() / 1000);
  var auth_timestamp = d;
  var auth_version = '1.0';
  var bodymd5 = byteToString(Utilities.computeDigest(Utilities.DigestAlgorithm.MD5, bodystring));
  var wholething = `POST
/apps/${pvals["appId"]}/events
auth_key=${pvals["key"]}&auth_timestamp=${auth_timestamp}&auth_version=${auth_version}&body_md5=${bodymd5}`;
  var wholethingencrypt = byteToString(Utilities.computeHmacSha256Signature(wholething,pvals["secret"]));
  Logger.log(wholethingencrypt);
  

  var options = {
    'method' : 'post',
    'contentType': 'application/json',
    // Convert the JavaScript object to a JSON string.
    'payload' : bodystring,
    'muteHttpExceptions' : true
  };
  var urltry = UrlFetchApp.fetch(url+`?auth_key=${pvals["key"]}&auth_timestamp=${auth_timestamp}&auth_version=${auth_version}&body_md5=${bodymd5}&auth_signature=${wholethingencrypt}`, options);

  
  }
  
function byteToString(byte) {
  var signature = byte.reduce(function(str,chr){
    chr = (chr < 0 ? chr + 256 : chr).toString(16);
    return str + (chr.length==1?'0':'') + chr;
  },'');
  return signature;
  }

Make sure you make the changes in the top 4 lines before moving forward.

Next you have to create a web app. Make sure to set it to execute as you but be available to everyone.

The first time you should choose “new deployment” and choose “web app”

Now you can go to the url provided and it should be working!

How it works

When someone goes to the url, google sends them all the questions along with the vote tally for each. It also checks the local users cookies to see if they’ve supplied any votes. If they have, it doesn’t let them vote again. This prevents ballot box stuffing, but you should know that it’s pretty easily defeated using incognito windows.

The user can enter questions or “upvote” existing questions. When they do, an AJAX call is made to the google server (any time you see google.script.run… that’s what’s happening) where google either saves the new question (making sure to give it a unique id) or saves the vote. In either case it saves the timestamp.

After updating the spreadsheet, the “sendtopusher” function runs, sending along either the new question (along with its id and an initial vote count of zero) or the id of the new vote. That uses the webSocket that pusher has set up to send that info to all connected devices.

If a device receives a new question from pusher it adds it to the list and re-displays all the questions. If a new vote comes in from pusher it adds to the vote count for that id and re-displays all the questions (this also involves sorting based on the vote count so that the highest voted question is always at the top).

Your thoughts?

I’d love to hear your thoughts. Here are some starters for you:

  • Why do you sometimes capitalize google and other times you don’t capitalize Google?
  • This is cool, can it also . . .
  • This is a rip-off of my cool idea. You can send checks to . . .
  • This is dumb. How does this preserve the time honored tradition of the first person asking not so much a question as a 10 point rebuff of everything they heard?
  • You really can’t draw very straight arrows. It’s almost as if you’re writing this post on a chromebook on your lap at LAX
  • I can tell you made that vid on Loom. Why didn’t you just embed that instead of downloading it from loom, posting it on youtube, and then embedding that?
  • I was at this workshop and I found this very useful.
  • I was at this workshop and this was incredibly distracting
  • Gross, I didn’t need to know that you had this idea in the shower.
  • Here’s another way to protect against ballot box stuffing . . .
Posted in Google Apps Script, syllabus creation | Tagged | 2 Comments

Brachistochrone for rolling things

The Brachistochrone curve is the shape of a wire for beads to slide down (friction free) to get from point A to point B the fastest. Note that since I used the word “down” there I’m implying this happens in gravity. Here’s an old post of mine describing how I go about teaching it. This post is all about scratching an itch I’ve had for a while: What if instead of sliding beads we want to roll balls. Is the shape the same? Spoiler: Nope, not the same.

My first thoughts had to do with how you’d factor rolling into the typical analysis. Normally you determine the integral formula for the time to go from A to B on an arbitrary curve given by y(x):

\text{time}=\int_A^B dt=\int_A^B \frac{ds}{v(s)}=\int_A^B\frac{\sqrt{1+y'^2}dx}{\sqrt{2\text{KE}/m}}

where y’ is the slope of the curve, s is how far along the curve the bead has gone, v is how fast the bead is traveling, and KE is the kinetic energy which is usually a function of y (since you’re cashing in gravitational potential energy). So if it’s rolling without slipping, my first thought was that all I had to do was add in some rotational kinetic energy:

\text{KE}=\frac{1}{2}m v^2+\frac{1}{2}I\omega^2

But then I realized that I had to know exactly where the center of mass was in order to figure out how much potential energy had been cashed in and I went down a rabbit hole.

Does the center of mass follow the same curve? (No!)

You’ll see that at this point I jumped on twitter for the first time in a while (hey, my job is different now and a lot of what I do is untweetable, give me a break).

If you scroll through you’ll see some curves that I no longer stand behind

If you have a curvy road and you know the mathematical formula for one side (let’s say the road is going left to right along what we’ll call the “x-axis” and that it doesn’t turn back on itself so we can call it a function). Do you know the formula for the other side of the road? Is it just the same function with a shift? Nope. It took me a while to convince myself but this is the figure that sold me:

Blue: right side of the road. Orange: right side of the road with a constant added. Green: the left side of the road

The blue curve is a pure sine function (why would I ever use cosine?). The orange curve is something like “sin(x)+0.32”. The green curve is what took me a while to derive but it’s really what enables a 0.32 diameter ball to fit between green and blue everywhere. Note that green and orange have the same amplitude and same frequency. Therefore, since they don’t overlap, the green curve is not a sinusoid.

So how do you derive the green curve? Well, here’s how I did it:

This represents a zoomed in version where locally the curve is flat. Also note that if you’re rolling up the other side (when the slope is positive) you need to make some adjustments to the signs in those equations. But that’s really all it takes. If you have a function for y(x) and you can calculate its slope at every location (y’), then you can figure out where the center of mass of the ball will be when you know the contact point with the curve.

Obviously I coded that in and ran it for a sine curve to get the figure above, but my same code would work with any (differentiable) function. Note that if the curve has a constant slope, the adjustments for the center of mass location are constant and then the other side of the road is truly just a shifted function. But that’s the only case that leads to that simple conclusion.

Alright! Let’s solve a complicated differential equation!

Ok, so now we know how to find the center of mass location when you know the contact point. It seems like we could figure out the potential energy drop (and hence the kinetic energy) since we know the vertical drop of the ball. Seems like we’d be in business! Alas, no, we’re not. The problem is the angular frequency, or \omega in the equation above.

For rolling without slipping on a flat surface, you know that your linear speed and rotational speed are tied together, namely \omega=v/r. Unfortunately, that’s not the case when rolling on a curved surface. This web page helped me understand this a little better. When you have a curved surface that has a local radius of curvature, \rho you get this for \omega:

\omega=\frac{\rho-R}{\rho R}v

where v is the speed of the contact point along the surface.

No big deal, right? it’s just some weird multiplier in front of the speed. That should make solving for the speed from the kinetic energy easy! Well, that’s what I thought, and certainly that’s what led to me erroneous twitter posts (if you scrolled through). Unfortunately, \rho, you know that pesky local radius of curvature, is not easy to deal with. From wikipedia I learned that:

\rho=\frac{\left(1+y'^2\right)^{3/2}}{y''}

Ugh! Do you see that denominator?! Suddenly you need to know not just the slope of the function but its curvature as well. Let me tell you, that makes things gross.

Ok, gross maybe we can handle. We know how to calculate the kinetic energy and it’ll be all in terms of the (unknown) function, its slope, and its curvature. Maybe we can just close our eyes and throw it to Mathematica. Here’s where we’re at:

\text{time}=\int_A^B \frac{\sqrt{1+y'^2}}{\frac{\left(1+y'^2\right)^{3/2}R/y''}{\left(1+y'^2\right)^{3/2}/y''-R}\sqrt{\frac{M g \left(y_0-\left(y-\frac{R/y'}{\sqrt{1+1/y'^2}}\right)\right)}{\frac{1}{2}(I+MR^2)}}}dx

Fun right! Anyways, it’s technically all set to use the calculus of variations, but I’ve tried it, and wasn’t able to make any progress. 😦 I think the biggest problem is the y”s in there because they lead to a third order differential equation, which means I need to supply not only where to start the curve and what direction to head, but also the local curvature right there. Needless to say, I didn’t make much progress. If you have ideas, I’m all ears!

By the way, here’s what it looks like if you’re just doing a bead sliding down a wire:

\text{time}=\int_A^B\frac{\sqrt{1+y'^2}}{2 g (y_0-y)}dx

Muuuccch easier, trust me. (Also note that if you thought I’d be using the word “cycloid” by now, you don’t get there this way. You only do if you swap x and y. You know an “obvious” thing surely your students would think to do.)

When in doubt, check the literature

So I started googling. Here’s an awesome paper from 1946 that helps us put it all together. What they’re saying is that even when rolling on a curved surface, you can use \omega=v/r as long as you’re using the speed of the center of mass, not the speed of the contact point. Alas, even though they’re always moving in parallel, they don’t have the same speed (think about going up and over a hump in a roller coaster, you’re moving faster than the contact point on the track). Note that they’re also saying that the center of mass follows the traditional brachistochrone! So what is this post all about!? Well, we want to know the shape of the track the ball is rolling on, and if you’ve read what I wrote above you’d know that’s different!

How did they prove it was the traditional curve? Because you get the very simple equation above instead of the incredibly ugly one if you use the coordinates of the center of mass and not the contact point. With that same simple equation, you get the same simple result (if you must: a cycloid).

But now we can put it all together. If I have a normal brachistochrone, I can find the curve for the ball to roll on by doing the coordinate shift in the figure above in reverse!

Blue is the shape of the track for the ball to roll on and red is the path of the center of mass

I know, I know, the blue path (the track for the ball to roll on) sure looks like a standard brachistochrone, but it’s not, because of what I was talking about above. Don’t believe me, let me hear it!

Update!

I don’t know why I didn’t do this last night, but here’s that same image with an added brachistochrone from the start to the finish of the track in green. See, I told you the blue curve wasn’t a brachistochrone:

Red: brachistochrone that the center of mass follows for a ball rolling without slipping on the blue track. Blue: The correct shape of a track for a ball with radius 0.1 to roll from the start to the finish the fastest. Green: the correct brachistochrone for a bead to slide on from the beginning of the track to the end of the track the fastest.

Starters

Your thoughts? Here are some starters for you:

  • What do you mean all you had to do was say “down” to imply gravity?
  • Seriously, I have to read a whole other post of yours just to be able to read this one. No way! I’m unclicking. You can’t count my click.
  • What do you have against rabbits? Why does going down their holes feel like an interminable complicated journey?
  • What do you mean about your job being untweetable?
  • What do you have against cosine?
  • Duh, of course you needed to know about the curvature. What are you, an idiot?
  • I know exactly where you made a mistake in that big ugly equation. For $5 I’ll tell you.
  • Of course switching x and y is obvious. What’s you’re point?
  • Hang on, this was solved back in 1946 and I had to read nearly your whole post to get there? Jerk.
  • That blue curve is a brachistochrone and I’ve blogged about this a bunch. Try reading some time.
Posted in math, mathematica, physics, teaching | 6 Comments

License plate math game

I do lots of things while I ride my bike to work to pass the time. Recently I’ve invented this game (surely others have too):

  1. Pick a target integer (I start at zero and move up by one in each iteration)
  2. Find a license plate (defined to be one with 3 integers on it like MN has)
  3. Find a way to insert mathematical operations before and between the numbers so that the result is your target

Here’s an example: Let’s say your target is 15. Here are a bunch of potential plates:

  • 135 (1*3*5)
  • 453 (45/3) note that just lumping 2 (or 3) numbers together is allowed
  • 771 (7+7+1)
  • 241 (2^4-1)

You get the gist.

I have three challenges for you:

  1. Find a plate that gives you the most possible targets.
  2. Find a plate that gives you the most consecutive targets.
  3. Find the target with the most plates that work

Here’s my quick stab at number 2: A plate with “123”:

  • Target of 0: -1-2+3
  • 1: -1*2+3
  • 2: -(1^2)+3
  • 3: (1^2)*3
  • 4: 12/3
  • 5: 1*(2+3)
  • 6: 1+2+3
  • 7: 1+2*3
  • 8: 1*2^3
  • 9: (1+2)*3 (or 12-3)

I got stumped trying to do 10.

Can you do better?

Your thoughts? Here are some starters for you:

  • I love this. What I do is . . .
  • This is dumb. The worst part is . . .
  • Do you care if the sign of the answer is correct?
  • Why don’t you code this up in Mathematica to figure out 1, 2, and 3?
  • Is this what all Provosts do?
  • Why don’t you watch the road when you ride?
  • Next you’re going to tell me you factor mile marker signs.
  • Hey, idiot, here’s how to get 10 with “123”
  • Are roots allowed (like 3root8 would be the cube root of 8)?
  • I think you shouldn’t be allowed to . . .
  • I invented this years ago. Here’s the address to send all the cash you’re going to earn from this blog post . . .
Posted in fun, math | 2 Comments

Book editor in Google Apps Script

I’m teaching a class in the fall called “Web App Development with Google Apps Script” that I think I want to write my own book for. I started doing some of that using wikibooks, but I was frustrated at some of the limitations that platform has, namely that you have to click around a lot as you’re going back and forth among sections and it’s really hard to add images, as most are considered to be copyrighted unless you jump through a bunch of hoops.

So I thought it might be fun to see if I could make a book editor in Google Apps Script. That’s pretty meta, huh?

tl;dr? I made a ton of progress. Here’s a vid showing the features.

What features am I looking for?

Here’s the things that I’m interested in having for a book editor:

  1. Editable anywhere (really I just mean that it should be browser based).
  2. Simple formatting (Markdown is my usual go-to)
  3. Ability to add and embed images easily
  4. Code highlighting (Markdown plugins to the rescue)
  5. Easy linking to other sections
  6. Easy mathematical typesetting (maybe not for this class, but still)
  7. Easy way to build shortcuts (like typing <<GAS>> to produce “Google Apps Script”)
  8. Available to everyone, but editable by only me

It turns out that a combination of bootstrap, mathjax, markdown-it, and highlighter cdns and built in GAS features enabled me to build all 8 in, so I’m pretty happy for the moment.

Markdown

Not familiar with Markdown? It’s really just a way to type readable notes that can be rendered into decent html. It doesn’t have every bell and whistle, but it’s got enough for my taste. Here’s a great page describing the typical features.

Image management

For my dashboard project I figured out how to upload images to google drive and how to determine the url that can be put into an img tag. So I just reused that code, but augmenting it to let me put in a description that’s the default alt text to be used. I also made it so that you can browse the images you’ve already uploaded if you want to reuse them elsewhere in the book.

The other cool thing I learned how to do was to populate something in the browser’s clipboard on demand. Very cool.

Shortcuts

I used to love the shortcuts I could create in \LaTeX documents. Things like \qm for “Quantum Mechanics” etc. I realized I could do that in this project too, but at first I just hard coded them into the rendering portion of the code. Basically I did a bunch of:

displayText = displayText.replace(/<<qm>>/g, "Quantum Mechanics")

However, I realized I could just put the pattern (/<<gm>>/g) and the replacement (Quantum Mechanics) into spreadsheet columns and then just run through as many as the user wants to add.

So now I just edit my spreadsheet with new shortcuts (I called them filters but the idea is the same) and the next time I load the editor those shortcuts are available.

User Authentication

GAS is really great for user authentication. This command gets you the email of the current user:

var email = Session.getActiveUser().getEmail();

and you can do whatever you want with that, including allowing editing vs limiting the user to viewing your book. When you deploy a Web App you can say that it executes as you but that it’s available to the world. When someone outside of your domain goes to your web site, the command above returns an empty string. But when someone in your domain goes to it, you get their email. So you could imagine lots of editors, for example.

Limitations

GAS has lots of limitations. It’s not particularly fast, though once you pass your data to the user it’s really fast then. Sending data back and forth to the google spreadsheet usually takes a couple of seconds, which isn’t the end of the world given all the other features you get (for free!).

I pass to the user all the chapter and section names but not the detailed text of the sections, only sending that for the chosen section. So each time you go to a new section, it has to send an asynchronous request to google to get it. Again, ~2 seconds.

I’m assuming my book will get long enough that sending the whole text of the book will be problematic, so that’s why I only ever have the text from one section in memory.

Since it’s all being saved in a google spreadsheet, you have some fundamental limits to length. There are some conflicting sources out there, but there’s agreement that you can’t have more than 5,000,000 cells in the spreadsheet. That’s a lot of chapters and sections. There’s some sources that say no single cell can have more than 50,000 characters, but it seems that not everyone agrees. Assuming an average word length of, say, 8 characters that would mean that sections of the book would have to be less than 6,000 words. Since none of my blog posts have ever been that long, I don’t think I’m worried about that.

What’s it good for?

Of course I built this to write a book for my class, but since it’s all contained in a spreadsheet, it’s super easy to make copies! If you go to this spreadsheet and make your own copy, you too can write a book. All you’d have to do is:

  1. Clear out all the data (but not the top rows) in each tab. Note that column E in the “sections” tab is hidden, you’ll want to delete those too.
  2. Update your chapters and section numbers (watch the end of the vid linked above to see how that works)
  3. Go to tools->script editor
  4. In the script editor, update the top 2 lines of the globals.gs file
    1. Note that you’ll want to make a new folder for your images and set it to viewed by anyone
  5. Go to Deploy in the upper right
  6. Click on “New Deployment”
  7. Choose “Web App”
  8. Follow the instructions and deploy. You’ll be shown your new URL

I think I’ll probably use it for a lot of things. Even in classes where I’m not writing a book, I could still use it for organizing additional resources for my students.

I also think it might be really great for making manuals on how to do things.

Your thoughts?

Here are some starters for you:

  • I love this, especially the part about . . .
  • I hate this. Why don’t you just use . . .
  • Wait, this is for the fall term? Don’t you have some final projects to grade?
  • I think you should teach a class that teaches people how to make this tool that lets them write a book for a class on how to teach the class. That would be more meta.
  • I think it would be cool if you could add . . .
  • Markdown is just watered down \LaTeX. Why not use that instead?
  • I’ve got a great idea for what I’d use this for . . .
  • I’ve got a great idea for how you should never use this . . .
Posted in Google Apps Script, syllabus creation, teaching, technology | 2 Comments

Programming for me vs you

I almost titled this “I hate ‘input’ and ‘print'” but that’s not really true.

I’m teaching a course called “Introduction to Computational Data Science” this semester, just like I did last spring, and even with only two days under my belt I’m reminded how much I struggle with ‘input’ and ‘print’ commands. I think it has to do with the years I’ve spent programming Mathematica but using Jupyter and/or Colab feel quite similar.

So what am I referring to? The first assignment in this class (which has a programming class as a prerequisite) is for the students to make a video walking me through a python function they’ve made that takes an value and returns a list that’s dependent on whether the value is even or odd. It’s also supposed to throw an error if the value is not an integer. It’s really a quick test of their programming ability, and it lets me diagnose things quickly for those who might need a little help.

What’s the big deal, right? Well, nearly all the students do something like this:

def myFunc():
   x=int(input("please give me a number, you wonderful stranger"))
   if x%2:
      for i in range(x//2+1):
         print(i)
   else:
      for i in range(3*x):
         print(i)

Why, you may ask? Because that’s how a lot of their text last semester encouraged them to do things and even the text I’m using, which has a lot of basic python chapters that I only use as reference, basically encourages that sort of function.

But I hate it! Ok, that’s, again, too strong. But I do have some problems with it, and it has to do with who the audience is.

Often in introductory programming courses you’re encouraged to think about a fictional client that you’re writing code for. Hence the “you wonderful stranger” joke above. And for clients like that, printing nice messages or values is quite a reasonable thing to do (hence the ‘print’ commands).

But for computational data work, my audience is often (always?), well, me! For me, just making a function that takes an argument and then later calling it with whatever argument I want works just fine:

def myFuncForMe(x):
   if type(x) != int:
      return []
   if x%2==0:
      return [x**2 for i in range(x//2+1)]
   else:
      return [x**3 for i in range(3*x)]
myFuncforMe(2)

Lots to unpack there:

  • The function takes an argument instead of relying on “input”. That means that it can be used in a larger program
  • The function always returns a list, though if it’s not an integer it’s an empty list. This should help it fit into larger program
  • No print statements! This is a workhorse little function that can be called a bunch of times and it won’t clutter up your workspace.
  • Beautiful list comprehensions instead of clunky for loops. Often if I’m looping through something I’m creating a new list and that’s what list comprehensions are built for

So if you’re slowly building a tool set that might let you gather and analyze big data, I don’t think you should be using “input” or “print” commands, at least not very much. They’re for debugging, sure, but if you’re using Jupyter or Colab, just start a new line of code to check stuff. Plus if you’re using those you can tell the story of what your code is doing so much better than if you use Spyder or some other IDE.

Ok, rant over. Your thoughts? Here’s some starters for you:

  • I’m in this class right now and I need to go back and change my homework submission.
  • I’m in this class right now and I need to know how I drop.
  • I like this. While we’re at it, let’s try to keep students from using . . .
  • I hate this. Don’t you realize how powerful “input” and “print” are?! For example . . .
  • I like the two-audiences approach you’re taking. What I would add is . . .
  • If you’re not writing code for someone else to use you can’t call yourself a programmer.
  • If you’re writing code for someone else to use you can’t call yourself a programmer.
  • I love Jupyter/Colab for these reasons and more . . .
  • I turned my homework in last night and I assumed you’d be grading it instead of writing this drivel
Posted in programming, teaching | 6 Comments

Catenary with Lagrange Multipliers

The catenary is the shape of a hanging chain supported at both ends in a constant gravitational field (ie normal life). Recently Rhett Allain has been doing some great work using both python and analytical results to show how you can calculate and simulate a catenary.

His work reminded me that I had never finished an approach to this problem that I hatched several years ago. I wanted to see if I could use Lagrange multipliers to ensure that the spacing between the beads (I’m modeling a beaded string much like Rhett) stays constant. I wanted to start the string in some initial configuration with the two ends fixed and let it then evolve over time, with a fair amount of friction added, so that it would settle into the final shape, ie the catenary. The problem was that I was stuck on how best (or at all!) to set up the initial configuration such that all the spacers between the beads was fixed and it stretched from one fixed point to the other.

With Rhett’s inspiration, however, I figured out a way to do it. I think I was stuck on some sort of evenly distributed setup where the beads zigzagged up and down with just the right angle so that the string would make it to the other end without having to stretch any of the spacers. But I found an easier way.

I pick one of the beads towards the middle (actually almost any bead will work with the possible exception of the beads closest to the fixed points) and find where I can put it so that the string bends only at that bead. In other words, the beads form a straight line from the first fixed point to that chosen bead and then a different straight line to the second fixed point.

At first I thought this would be lucky if I could get it to work but after drawing a bunch of circles I convinced myself that you can (nearly) always find a location for that chosen bead that works.

With that, the initial conditions match all the constraints and I can get to the calculation!

As I note at the bottom of this post, I can model this as a bunch of seemingly free particles (so model x(t) and y(t) for every bead) that are exposed to gravity along with an unknown Lagrange multiplier for every spacer constraint. So that’s what I did. Here’s the Mathematica code:

Mathematica code for modeling a beaded string with Lagrange Multipliers

Ok, here’s what I have so far:

Minimal friction
More friction
adjusting the right fixed point to be lower

It works pretty well! One cool thing about doing Lagrange Multipliers is that they tend to tell you about the forces required to maintain the constraint, namely making sure that all successive beads are held a fixed distance apart. Here’s a plot of those forces for the second animation above:

Tension forces for every separator (between successive beads). Positive “tension” means they’re pushing the beads apart to maintain the spacing. Negative means they’re pulling them together.

So, thanks to Rhett’s great work I finally got back around to this. I really like his simulation approach, which basically puts really strong springs in as the spacers. But I’ve always wanted to see if you could use Lagrange Multpliers to enforce the contraints without resorting to those springs.

Your thoughts

What do you think? Here are some starters for you:

  • I like this, but I like Rhett’s way better. Maybe you could …
  • I think this is dumb, I never fire up Mathematica when I hang things.
  • I’m in class with you tomorrow and I don’t see how this has anything to do with Computational Data Science.
  • Let me know when you’ve done this in vpython.
  • I don’t understand why you take two time derivatives of the constraint equations. I thought you said you don’t have to do this anymore
  • Why can’t you just reduce the dimensionality of this problem and just do a bunch of angles? Then you could figure out the constraint forces by finding the accelerations of all the beads that isn’t provided by gravity.
  • Can you model it with one of the ends moving? (Answer: oddly no! I tried that and the last spacing wasn’t constrained. Not sure what’s going on there)
Posted in mathematica, physics | Leave a comment